🥬 Food Cost Yield Calculator
Calculate true usable yield, trim loss & yield percentage for any ingredient
| Ingredient | Yield % | 1 lb Raw → Usable oz | 1 kg Raw → Usable g | Waste Type |
|---|---|---|---|---|
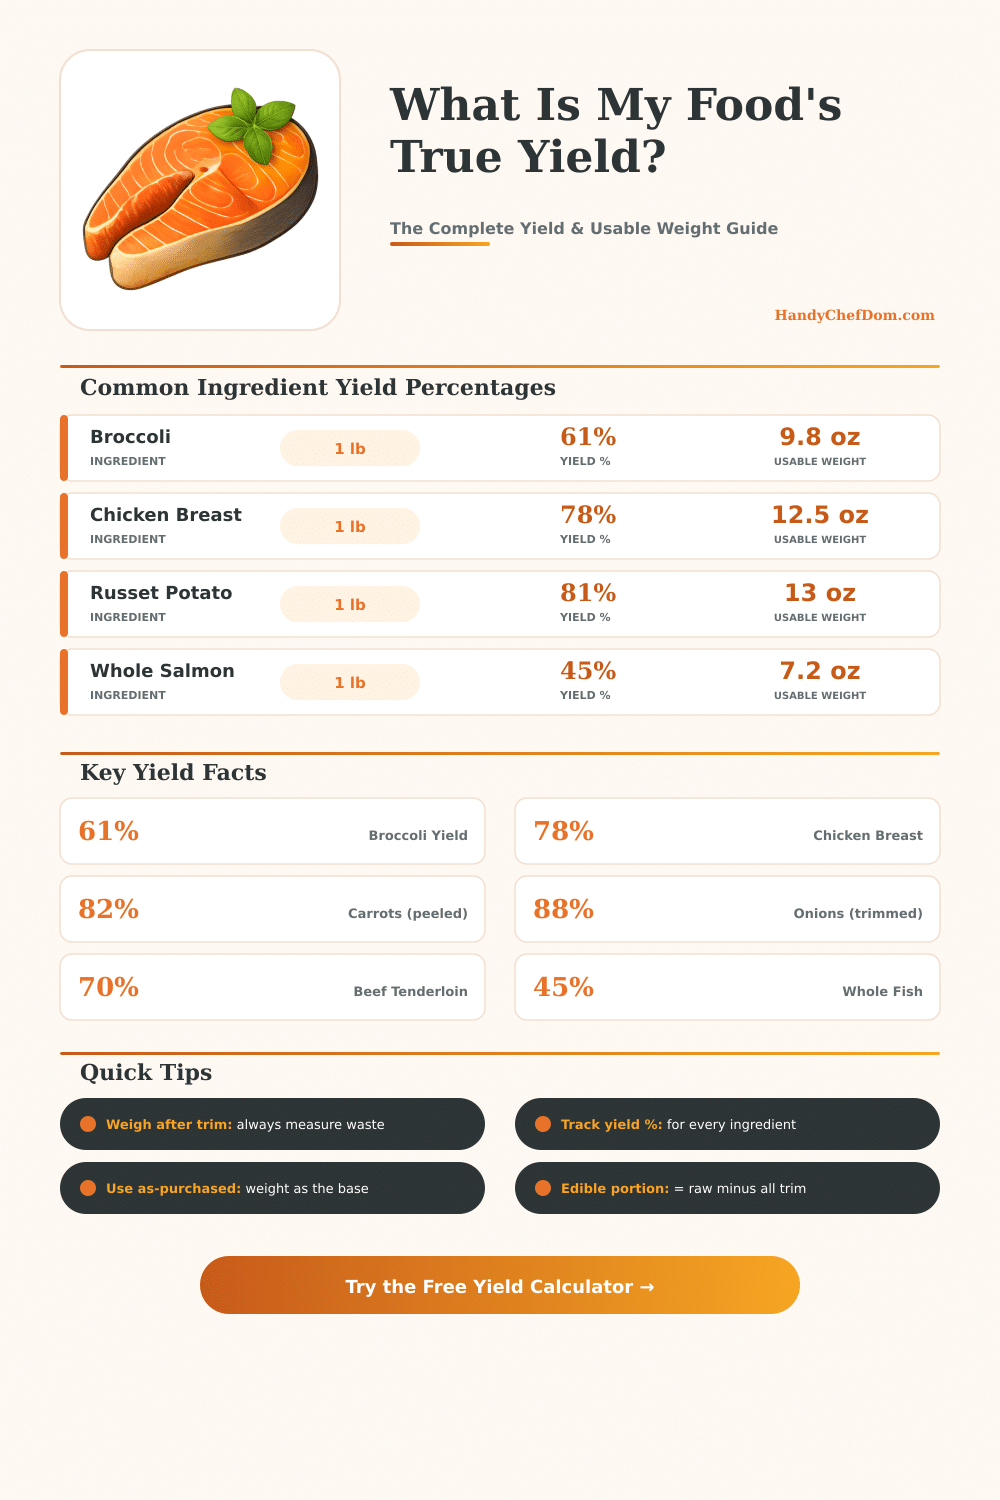
| Broccoli (florets) | 61% | 9.8 oz | 610 g | Stems, leaves |
| Chicken Breast (boneless) | 78% | 12.5 oz | 780 g | Fat, tendons |
| Chicken Thigh (bone-in) | 67% | 10.7 oz | 670 g | Bone, skin, fat |
| Whole Salmon (fillet) | 45% | 7.2 oz | 450 g | Bones, head, skin |
| Salmon Fillet (skinless) | 90% | 14.4 oz | 900 g | Pin bones, skin |
| Russet Potato (peeled) | 81% | 13.0 oz | 810 g | Skin, eyes |
| Onion (trimmed) | 88% | 14.1 oz | 880 g | Skin, root end |
| Beef Tenderloin (trimmed) | 70% | 11.2 oz | 700 g | Fat, silverskin |
| Whole Shrimp (peeled) | 50% | 8.0 oz | 500 g | Shell, heads, tails |
| Carrot (peeled & trimmed) | 82% | 13.1 oz | 820 g | Peel, tops |
| Iceberg Lettuce | 73% | 11.7 oz | 730 g | Outer leaves, core |
| Mango (peeled & pitted) | 75% | 12.0 oz | 750 g | Skin, pit |
| Avocado (pitted) | 75% | 12.0 oz | 750 g | Skin, pit |
| Bell Pepper (trimmed) | 82% | 13.1 oz | 820 g | Seeds, stem, ribs |
| Whole Chicken (roasted) | 65% | 10.4 oz | 650 g | Bone, skin (optional) |
| Beef Ribeye (trimmed) | 76% | 12.2 oz | 760 g | Fat cap, silverskin |
| Pork Loin (trimmed) | 80% | 12.8 oz | 800 g | Fat, silverskin |
| Cauliflower (florets) | 55% | 8.8 oz | 550 g | Stem, leaves |
| Spinach (cleaned) | 74% | 11.8 oz | 740 g | Stems, wilted leaves |
| Asparagus (trimmed) | 78% | 12.5 oz | 780 g | Tough ends |
| Formula | Calculation | Example | Result |
|---|---|---|---|
| Yield % | (Usable Weight ÷ Raw Weight) × 100 | (9.8 oz ÷ 16 oz) × 100 | 61.25% |
| Usable Weight | Raw Weight × Yield % | 5 lb × 0.61 | 3.05 lb |
| Raw Weight Needed | Usable Weight Needed ÷ Yield % | 3 lb ÷ 0.61 | 4.92 lb |
| Trim / Waste | Raw Weight – Usable Weight | 5 lb – 3.05 lb | 1.95 lb |
| Waste % | 100 – Yield % | 100 – 61 | 39% |
| AP Qty for Portions | (Portions × Portion Size) ÷ Yield % | (20 × 4 oz) ÷ 0.61 | 131.1 oz |
| Protein | Form | Yield % | 5 lb Raw → Usable |
|---|---|---|---|
| Chicken | Whole bird | 65% | 3.25 lb |
| Chicken | Bone-in breast | 78% | 3.9 lb |
| Beef | Tenderloin, trimmed | 70% | 3.5 lb |
| Beef | Ribeye, trimmed | 76% | 3.8 lb |
| Pork | Loin, trimmed | 80% | 4.0 lb |
| Salmon | Whole fish | 45% | 2.25 lb |
| Salmon | Skin-on fillet | 90% | 4.5 lb |
| Shrimp | Whole, head-on | 50% | 2.5 lb |
| Shrimp | Shell-on, headless | 66% | 3.3 lb |
| Lamb | Rack, frenched | 55% | 2.75 lb |
• Always weigh trim separately on the same scale for the most accurate yield.
• Yield percentages vary by season, supplier, and skill level — track your own kitchen averages over time.
• For portioning, always calculate raw (as-purchased) weight needed, not edible weight — it will always be more than you expect.
The food cost in short shows how far one spends to prepare one dish. It counts everything that ends on the ready plate from the ingredients. To estimate it, one gathers the amount of everything bought according to recipe.
Here one includes also the waste, for instance scraps and cores. That waste belongs to the food cost not only that which genuinely gets used.
How to Calculate and Control Food Cost
The percentage of food cost shows the share between spent money for ingredients and the income that they bring when one sells them as menu items. To estimate it, one shares the cost of ingredients by the selling price of the dish. The most many food businesses intend to keep the food cost between 30 and 45 percent of the sellnig price.
Some restaurants reach around 25 percent, which wants to say that ingredients cost only a quarter of the menu price.
A common rule of thumb says that roughly a third of the billed price goes to food cost, other third to work and the third to other expenses with profit. Even so that is only a broad landmark. The too mainstream expenses for restaurants are food and work, that together should involve 45 to 55 percent of the pure sale.
One has a simple formula to set menu prices. One shares the food cost by the wanted percentage of food cost, to receive the menu price. For instance, if steak costs five dollars whole and the target is 35 percent food cost, sharing five by 0.35 one receives around 14 dollars 29 cents.
Like this a bill around fifteen dollars would have sense. But it deals about more than only that. Free extras as bread, butter and ketchup all affect.
Also everything that sits on the plate except the mainstream food affects the calculation.
Standard recipes and checking of portions helps to keep costs stable. Control of portions ranks between the easiest and useful ways to manage food expenses. Costing of menu allows managers to estimate the expense for one serving and set fit prices.
The cost for one serving is the whole cost of the items divided by the amount of portions that it gives. If the amount of ingredients for one dish is twenty dollars and the recipe gives four portions, then the food cost for one serving is five dollars. These are useful to compare products and plan budget for meals.
Places for fast food commonly have high percentage of food cost, because salaries usually are lower in the kitchen and on manager level. General spending breakdown for a little fast food store could be like this: rent 15 percent, salaries 15 percent, food cost 40 percent and running expenses 15 percent, what leaves 15 percent for profit.
To well trace the spent food, one requires to know the value of starting stock, purchases during the week and final stock. The cost of food in a restaurant stays one of the most difficult parts to manage. Many chefs would like to give time to creation of good food instead of worrying about the numbers.
Even so knowing cost causes is important. The cost to serve a meal counts both upper elements and the real food on the plate. Profit matches to selling price minus food cost, minus work, minusfixtures and running expenses.