Ground Beef Iron Calculator
Estimate total iron, heme iron, daily value percent, raw-to-cooked yield, servings, lean ratio, recipe style, and batch scaling for burgers, tacos, meat sauce, bowls, casseroles, chili, and meal prep.
1Ground Beef Iron Presets
2Weight, Lean Ratio, Yield, and Serving Inputs
Enter raw ground beef weight or cooked drained weight. The calculator converts through cooked yield, then estimates total iron, heme iron, iron daily value percent, recipe portions, and scaled batch totals.
Ground beef iron result
Choose a preset or enter beef details, then calculate.
3Live Iron Snapshot
4Beef Lean, Cooked Yield, and Iron Grid
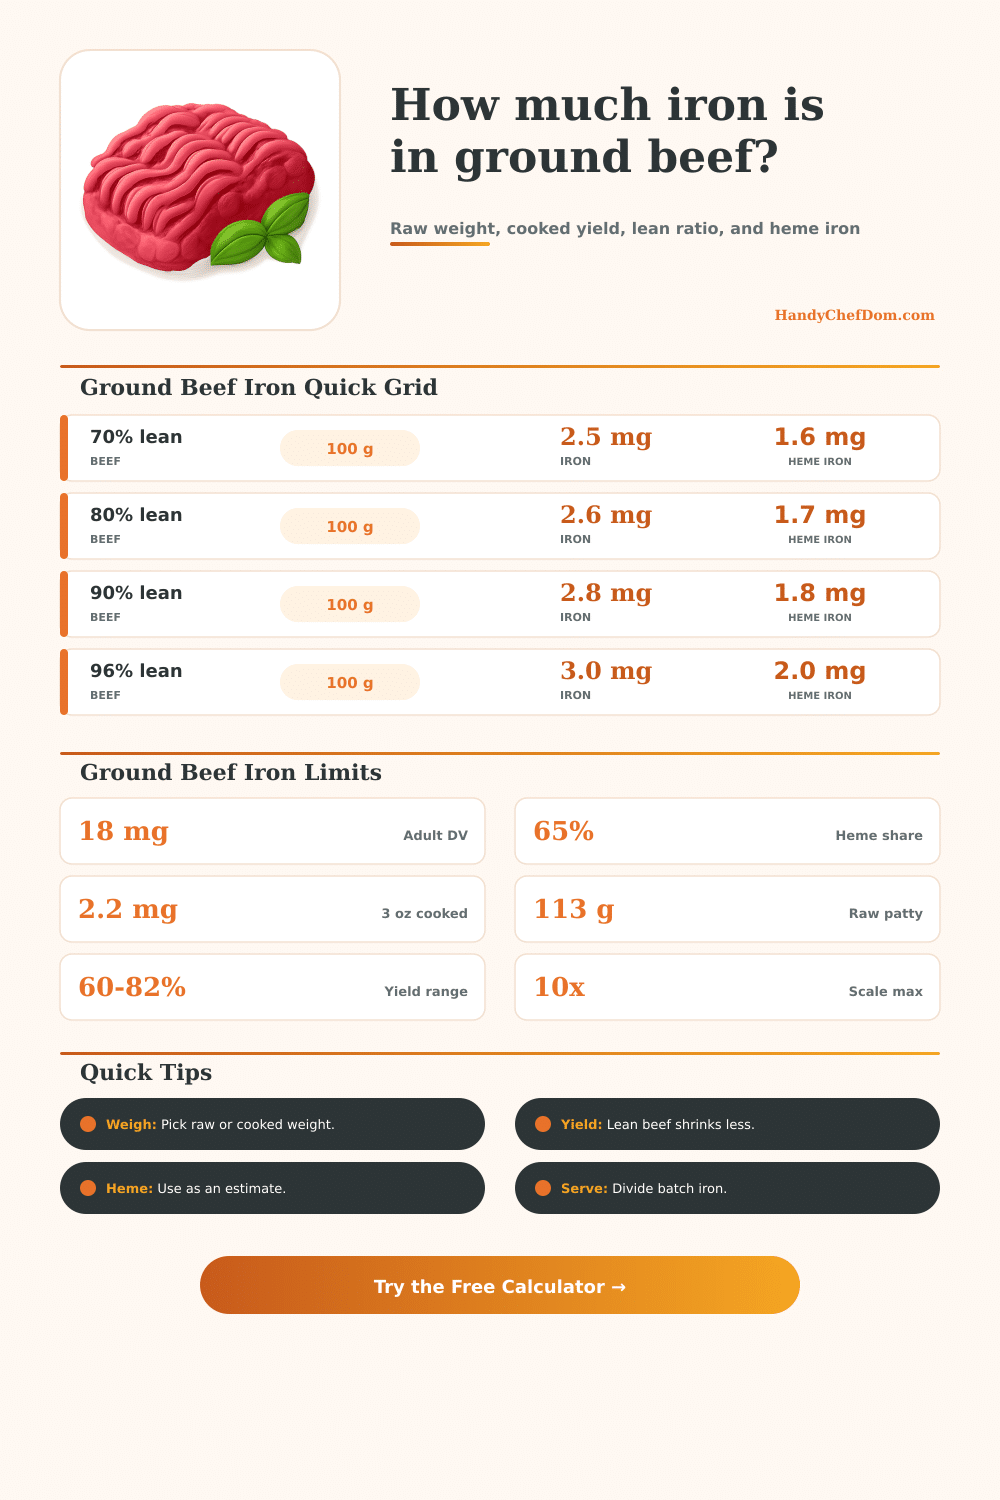
| Ground beef lean ratio | Typical cooked yield | Iron per 100 g cooked | Heme iron at 65% | Best use |
|---|---|---|---|---|
| 70% lean / 30% fat | About 60% | About 2.5 mg | About 1.6 mg | Juicy burgers, drained crumbles. |
| 75% lean / 25% fat | About 64% | About 2.55 mg | About 1.66 mg | Classic patties and diner-style beef. |
| 80% lean / 20% fat | About 70% | About 2.6 mg | About 1.69 mg | Tacos, burgers, sloppy joes. |
| 85% lean / 15% fat | About 73% | About 2.7 mg | About 1.76 mg | Everyday skillets and bowls. |
| 90% lean / 10% fat | About 76% | About 2.8 mg | About 1.82 mg | Meal prep and sauces. |
| 93% lean / 7% fat | About 79% | About 2.9 mg | About 1.89 mg | Lean casseroles and chili. |
| 96% lean / 4% fat | About 82% | About 3.0 mg | About 1.95 mg | Extra-lean macro tracking. |
5Raw to Cooked Ground Beef Yield Table
| Recipe style | Yield adjustment | What happens to weight | Iron interpretation | Calculator note |
|---|---|---|---|---|
| Patties or burgers | Base lean-ratio yield | Fat and moisture drip away. | Total iron stays with edible cooked beef. | Good default before cooking. |
| Crumbled skillet beef | Base yield minus 3% | Draining removes more rendered fat. | Cooked grams drop, iron per cooked gram rises. | Use before sauce. |
| Tomato meat sauce | Base yield plus 8% | Sauce and juices increase final portion. | Beef iron is diluted across wetter servings. | Add pasta iron separately. |
| Taco or burrito filling | Base yield plus 2% | Seasoning water partially stays in pan. | Beef remains the main animal iron source. | Sodium add-in is optional. |
| Chili or soup pot | Base yield plus 10% | Broth, beans, and tomatoes stretch servings. | Use other-ingredient iron for beans. | Serving count matters. |
| Casserole or meatloaf | Base yield plus 6% | Binders and pan juices remain. | Per serving iron depends on slice count. | Best for batch scaling. |
6Serving and Daily Value Examples
| Scenario | Beef input | Cooked estimate | Total beef iron | Per serving DV |
|---|---|---|---|---|
| Quarter-pound burger | 113 g raw 80% lean | About 79 g cooked | About 2.1 mg | About 12% of 18 mg |
| Taco skillet for four | 454 g raw 80% lean | About 327 g filling | About 8.5 mg | About 12% per serving |
| Lean meal prep | 680 g raw 90% lean | About 517 g cooked | About 14.5 mg | About 16% across five servings |
| Meat sauce batch | 454 g raw 85% lean | About 368 g sauced basis | About 9.9 mg | About 9% across six servings |
| Chili pot | 907 g raw 93% lean | About 807 g pot basis | About 23.4 mg | About 16% across eight servings |
| Cooked leftovers | 200 g cooked 80% lean | 200 g cooked | About 5.2 mg | About 14% across two servings |
7Ground Beef Iron Mode Comparison
Use when weighing a package, patties, or meatloaf mixture before cooking. Yield estimates cooked weight.
Use for leftovers, drained crumbles, and meal prep containers. The calculator reverses to raw equivalent.
Leaner beef usually yields more cooked weight and slightly more iron per cooked gram.
Scale a recipe without changing serving logic, heme share, or daily value targets.
8Two Practical Ground Beef Iron Tips
When you buy a bag of ground beef, you read the percentage to determine ratio of meat-to-fat. That doesn’t mean, however, that you’ll eat as much iron. The difference lies in what we’re assuming: most of us think raw weight = the nutrients we eat after cooking. This leads to calculation errors, but the calculator above fix this by including the weight lost from cooking and fat loss. It is a small difference, but it drastically affects your estimated daily intake.
To know what ratio makes sense, you need to understand cooking: Water evaporates, and fat renders out. A pound of eighty percent lean ground beef doesn’t become a pound of cooked hamburger; it becomes less. The calculator take that into account automatically. It accounts for the reduction in weight (or “yield”) due to cooking.
Why Cooking Changes Iron in Beef
To further refine the estimate, choose your recipe type. Burgers retain more moisture than a pile of meat crumbles used for tacos. Remember that the higher the concentration of fat and water lost, the greater the mineral content in the remaining iron. You’ll be consuming more nutrients by volume when you eat burger compared to some other form of the same raw ingredients.
Most nutritional calculators overlook heme iron, but beef contain this kind of iron, which your body absorbs much more readily than does non-heme iron in beans or spinach. Normaly, approximately sixty-five percent of a red meat’s iron content come from heme. You can plug this percentage into the calculator separately since it is typically such a large part. Knowing how much is heme and how much isn’t allow for balanced meal planning.
If you are looking to increase your iron intake, you will want to make sure lentils go into your burger bowl too. This adds bulk without increasing absorption rates as beef would of. It’s mostly the heme share that contributes to this.
There is one additional variable that is introduced by batch cooking: The iron content will scale at the same rate, but what feels like a modest portion may not be perceived as such (especially when you see it in the context of a big container). To address this, the tool let you enter how many servings you prepared and the multiplier factor (e.g., did you cook for 5 days?). This way, you don’t underestimate how much you are eating when preparing multiple meals.
It is also helpful to mix in some fortified pasta or tomato paste. Both of these add their own (non-heme) iron. Add these numbers yourself to ensure an accurat idea of the meal.
There are two kitchen realities: raw weight (planning before cooking) and cooked weight (measuring leftovers of last night’s dinner). To account for this, I added a Raw/ Cooked toggle that uses built-in default yields for recipes, then adjusts with your own lean ratio percentage. But when you want to track last night’s meal, it flips the math around to guess original density instead of guessing the weight after draining the grease.
But it’s laid out plainly enough on that same page (the table at the top), so you can see, e.g., that seventy percent lean beef will shrink more than ninety-six percent lean beef, which leads to a lower iron-density-per-hundred-grams-of-cooked-product while leaving you with less meat. And it’s not some sort of trivial academic thing: It matters if you’re planning to meet certain nutritional requirements, or trying to hit macro targets.
Fattier meat is going to have more calories and possibly lower mineral density (since there’ll be a larger volume loss). But it’ll also have more protein and iron per ounce of your final dish. Iron doesn’t dissapears when you turn up the heat; instead, the liquid leaves the iron behind in the solid muscle fibers. This means that cooking change how many nutrients are in your meal, so weighing your food before or after cooking is much more accurate for calculating nutrients.
The calculator plugs the gap between buying weight and eating weight. You input the variables, it spits out the results, and voila: A real-time picture of your iron intake. Forget the shrinking-meats guessing game and have clear-cut data to match what’s actualy going onto your plate. Turn the mystery of cooked weight into something manageable and know exactly where you stand with each bite.