🦌 Deer Meat Protein Calculator
Estimate total venison protein from real deer meat cuts, raw or cooked weight, yield loss, serving goals, fat blend, and jerky moisture loss.
Enter the weight you have, choose whether it is raw, cooked, or finished jerky, then tune the yield and blend details. Protein estimates use venison-specific raw and cooked values per 100 g.
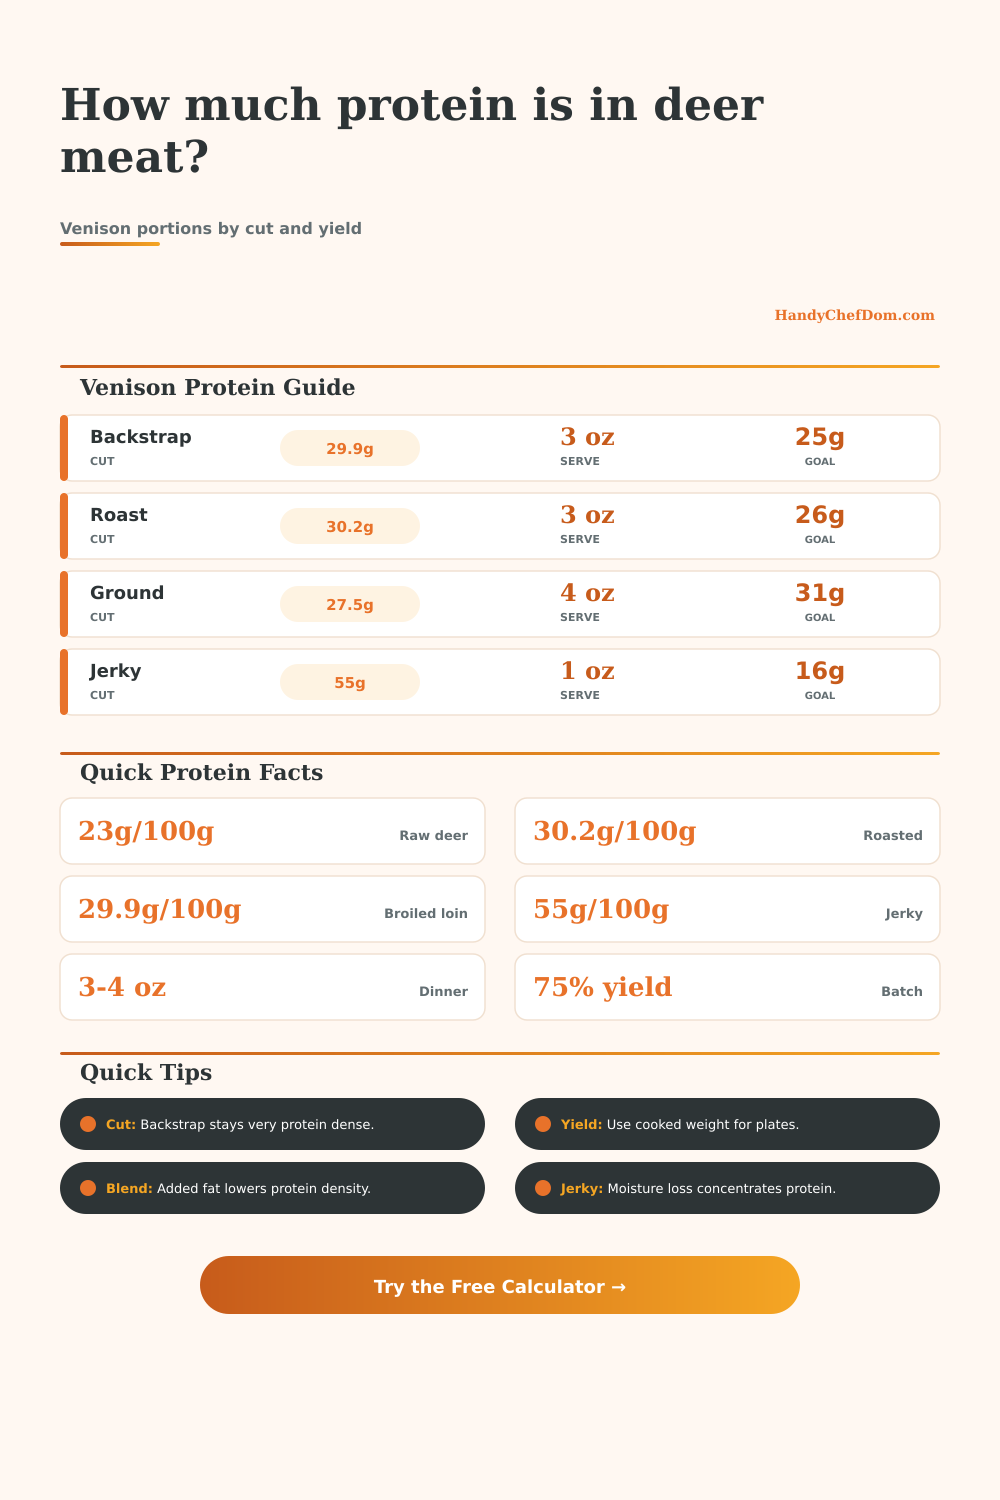
Baseline nutrition uses representative USDA-style values: raw deer about 23 g protein per 100 g, roasted deer about 30.2 g per 100 g, and broiled lean loin about 29.9 g per 100 g. Actual deer, trim, age, and added fat change the final number.
| Venison cut | Raw protein | Cooked protein | Best calculator use |
|---|---|---|---|
| General deer meat | 23.0 g/100g | 30.2 g/100g | Mixed trim, steaks, or average boneless deer meat. |
| Backstrap loin | 22.8 g/100g | 29.9 g/100g | Lean family steak dinners and grilled medallions. |
| Tenderloin | 22.7 g/100g | 29.8 g/100g | Small premium portions with very little trimming loss. |
| Round steak | 23.4 g/100g | 30.6 g/100g | Steaks, kabobs, stir fry strips, or slicer batches. |
| Shoulder or rump roast | 22.6 g/100g | 30.0 g/100g | Roast meal prep, sliced leftovers, and pulled venison. |
| Ground deer, lean | 22.4 g/100g | 28.5 g/100g | Chili, tacos, meat sauce, and lean burger patties. |
| Ground deer with fat | 21.0 g/100g | 27.5 g/100g | Venison burger grind when pork or beef fat is added. |
| Stew meat cubes | 22.9 g/100g | 29.6 g/100g | Slow cooked stew, braise, and Dutch oven portions. |
| Venison sausage mix | 19.8 g/100g | 24.8 g/100g | Linked sausage, bulk breakfast grind, or patty mix. |
| Deer jerky | 23.0 g/100g raw | 55.0 g/100g dry | Finished dried snack packs and trail portions. |
| Cut or method | Typical yield | Moisture loss | Protein effect |
|---|---|---|---|
| Pan seared venison steak | 74% | 18% to 25% | Protein concentrates in the cooked steak weight. |
| Grilled backstrap | 76% | 16% to 23% | Lean cut stays high in protein per cooked ounce. |
| Roasted shoulder or rump | 70% | 22% to 30% | Long roasting raises cooked protein density by weight. |
| Braised stew meat | 78% | 12% to 22% | Liquid holding can keep finished weight higher. |
| Ground chili batch | 82% | 8% to 18% | Added liquid may dilute plated protein density. |
| Deer jerky drying | 35% | 55% to 70% | Water loss makes each ounce much more protein dense. |
| Serving plan | Cooked portion | Protein estimate | Planning note |
|---|---|---|---|
| Steak dinner for 2 | 8 oz total | 68 g | Use tenderloin or backstrap with little fat blend. |
| Family backstrap dinner | 24 oz total | 203 g | Six 4 oz cooked portions land near 34 g each. |
| Ground deer chili | 32 oz cooked | 249 g | Fat blend and beans change protein per bowl. |
| Roast meal prep | 40 oz cooked | 340 g | Great for five 8 oz high-protein containers. |
| Burger patty prep | 48 oz raw | 286 g | Eight patties with a 10% fat blend average near 36 g raw protein each. |
| Jerky snack packs | 10 oz dry | 156 g | Ten 1 oz bags average about 15 to 16 g protein. |
| Added fat blend | Ground mix protein | Cooked density | When to use |
|---|---|---|---|
| 0% added fat | 22.4 g/100g raw | 28.5 g/100g cooked | Lean chili, taco meat, and macro-focused meals. |
| 5% added fat | 21.7 g/100g raw | 27.8 g/100g cooked | Moister burger grind with small protein drop. |
| 10% added fat | 21.0 g/100g raw | 27.0 g/100g cooked | Common burger blend that still stays protein dense. |
| 15% added fat | 20.4 g/100g raw | 26.0 g/100g cooked | Sausage-style texture with lower protein per ounce. |
| 20% added fat | 19.7 g/100g raw | 25.0 g/100g cooked | Rich patties where calories rise faster than protein. |
| 30% added fat | 18.4 g/100g raw | 23.0 g/100g cooked | Use only when you want a very fatty sausage mix. |
The bags is probably ready and the meat is in there too… but maybe you aren’t quite sure what’s on the inside of those block of venison. If you’ve got some venison at home, you’ll notice that it’s different from the supermarket variety of pork and beef, it’s denser and leaner. That means if you’re feeding a family or aiming for precise nutrition goals, the math become more complicated. You don’t have to guess at the conversion factors and coefficients; instead just enter your prep method and weight and let the calculator handle the math.
That brings us to the first variable that throws things off: the condition of meat. You can’t use cooked weight instead of raw weight. Venison shrink when you cook it, so the moisture gets concentrated, which also means that there’s more protein per pound after cooking. In other words, a cooked ounce contain more protein than a raw one does. So if you want to enter the weight of your backstraps into the tool, tell it they’re raw. Enter the weight of the sliced backstrap on your plate (assuming you didn’t eat all of them)? Then select cooked. Because as water cooks away, the density change, which screws up your results pretty badly if you mix up which one is which.
How to Measure Your Venison Protein
Ground meats also benefit from the addition of fats like pork fat or beef suet. Without adding anything back in, pure venison make a very dry burger because it’s that damn lean. If you’re mixing your own batch, most hunters will throw some beef suet or pork fat in there to ensure the patties don’t go dry. This obviously raises the caloric content per patty, but it also reduce the total amount of protein relative to the meat. By entering how much fat you’ve mixed in (in percent), it’ll drop the final estimate accordingly. Ten percent is typical for burgers; going up to around thirty percent move you more towards sausage territory, where the protein concentration is far lower. You’re sacrificing protein for moisture and texture but as long as you understand what you’re eating, it’s a fair trade.
Then there’s jerky: Because it goes through an extreme amount of drying, we put it in its own category. Basically, we’re left with a brick of flavor that pack quite a punch in terms of protein content. Per ounce, the protein content is much higher than in the fresh meat. For a sit-down dinner, the numbers look one way; but for a road trip or a long trail run, those numbers look very different. This moisture loss are included in the calculator, giving you a realistic idea of how many grams of protein can go into a small bag. It converts what may be a vague snack into a measured fuel source.
Not every pound of raw roast is a pound of sliced meat, so keep in mind the yield. Shrinkage, connective tissue, and trimming are responsible for reducing final edible weight. For example, if you pan sear, you may only be left with 74% of your original weight while a long braise will likely hang onto 80%. It depends on your preferred level of doneness, such as if you like rare steaks. Slow-braising roasts?) you’ll adjust the default yield percentage of the tool accordingly. Knowing how much you’re losing allow you to avoid under-serving your dinner party guest.
Also remember that every deer has its own characteristics, a muscled-up beast from this season is different than one from last year or from a different area of the country. Meat from a hard winter will be tougher and less fatty, so it may cook differently. Actualy, venison should of been handled with care. The calculator use average USDA-type numbers for a baseline. But depending on the cut and the exact animal you cooked, your results will likely differ by some degree. Use it as a guide, not a lab experiment; use it to get near the correct number then dial in with your own knowledge of how the meat behaves in your freezer.
Venison forces me to think ahead a little more in meal planning as compared to other meat cuts that I just purchase at the grocery store. Because you have an idea of what you’re dealing with, you can prepare accordingly and use it to its fullest potential. Knowing how much protein is in each cut allow you to plan the rest of your meal to match. Maybe some grains and/or beans will go with a lean steak. A rich roast could become Sunday dinner, or a dense jerky snack might call for fewer sides. It’s intentional.
We do this to consume the deer but also because we want our hunting efforts (what it took to get that animal back home) to have the greatest dollar-value possible. There’s no waste. Each piece serves a purpose. Each ounce counts.
The act of counting your ounces doesn’t only make for better eating; it makes for better strategy with a basic meat source. It goes from an “I’ll take what I can get” mentality to a “here’s what I’m going to get” mindset. Knowing your numbers equals knowing true value.