Salmon Vitamin D Calculator
Estimate vitamin D from salmon type, raw or cooked weight, serving count, and cooking yield using USDA-style mcg, IU, and %DV math
| Salmon Type | Raw Vitamin D | Cooked Vitamin D | Calculator Basis |
|---|---|---|---|
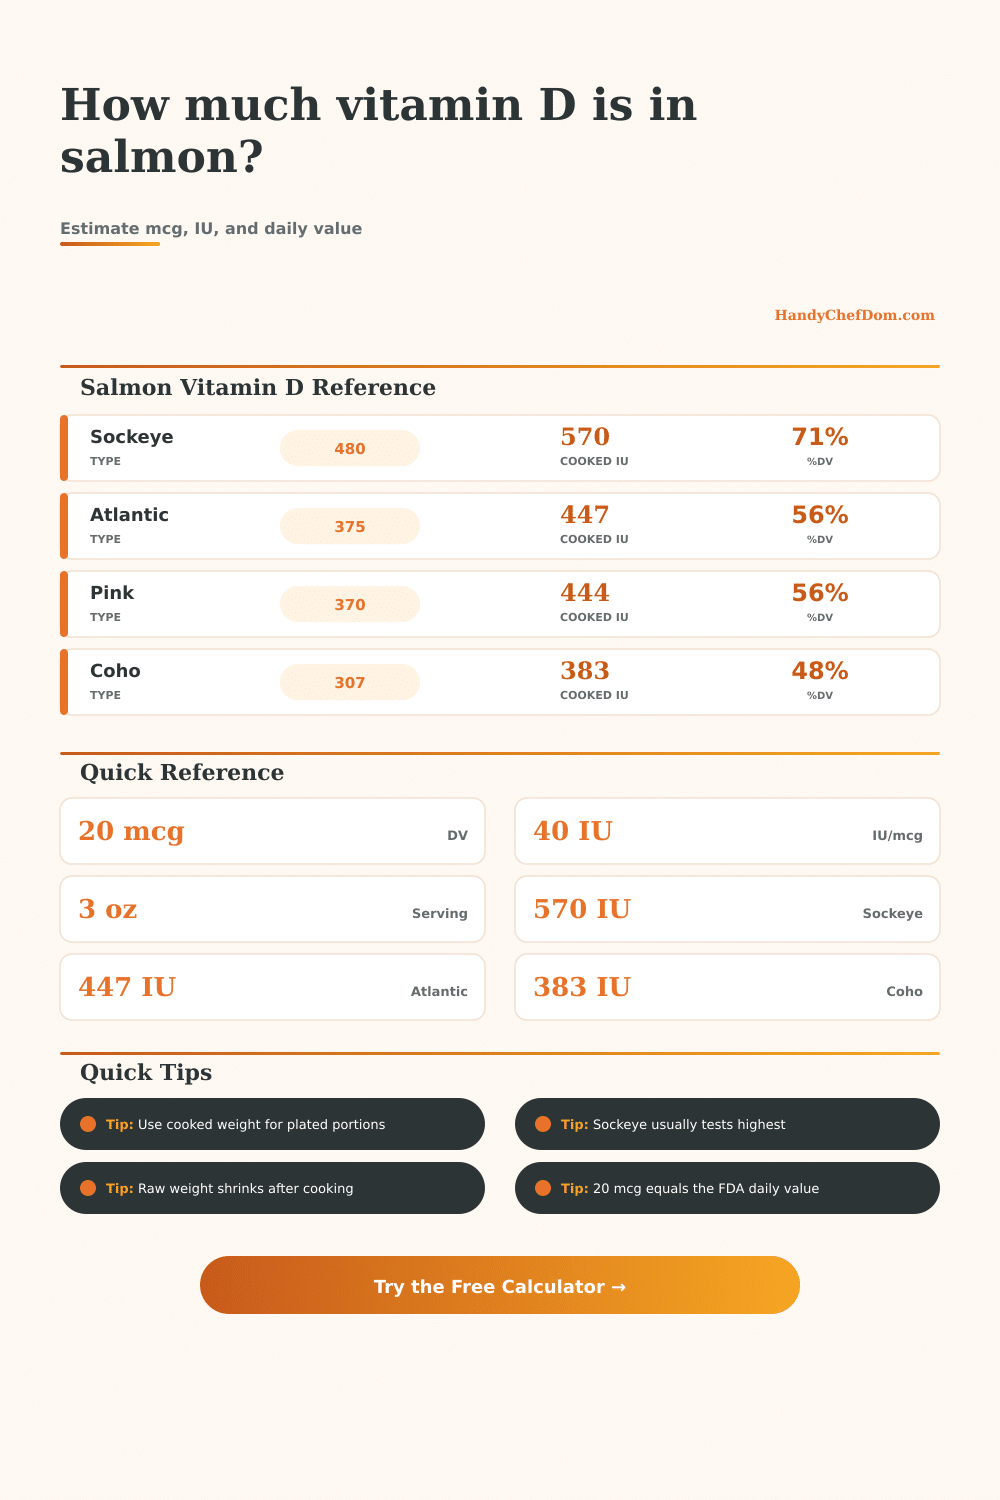
| Sockeye, fresh | 480 IU per 3 oz raw equivalent | 570 IU per 3 oz cooked | Highest fresh default |
| Atlantic, farmed | 375 IU per 3 oz raw | 447 IU per 3 oz cooked | Common fillet default |
| Pink salmon | 370 IU per 3 oz raw | 444 IU per 3 oz cooked | Lean cooked fillet default |
| Coho, wild | 307 IU per 3 oz raw | 383 IU per 3 oz cooked | Wild coho default |
| Canned sockeye | Ready-to-eat item | 715 IU per 3 oz drained | Use cooked basis |
| Smoked chinook | Ready-to-eat item | 194 IU per 1 oz smoked | Concentrated product |
| Profile | Cooked Yield | Default Retention | Use Case |
|---|---|---|---|
| Gentle bake or steam | 82% | 97% | Moist cooked portions |
| Standard bake or grill | 78% | 95% | Typical fillet planning |
| Firm roast or broil | 72% | 92% | More water loss |
| Canned or ready-to-eat | 100% | 100% | Drained or smoked items |
| Custom yield | User value | User value | Batch-specific estimate |
| Serving Style | Cooked Portion | Metric Portion | Planning Note |
|---|---|---|---|
| Small plated portion | 3 oz | 85 g | USDA reference serving |
| Standard dinner fillet | 4 oz | 113 g | Common cooked portion |
| Large dinner fillet | 6 oz | 170 g | High vitamin D serving |
| Meal prep bowl | 3.5 oz | 100 g | Easy nutrient math |
| Smoked salmon serving | 2 oz | 57 g | Use ready-to-eat basis |
| Measure | Value | Equivalent | Calculator Use |
|---|---|---|---|
| 1 mcg vitamin D | 1 mcg | 40 IU | mcg to IU conversion |
| FDA Daily Value | 20 mcg | 800 IU | Default %DV target |
| Adult RDA to age 70 | 15 mcg | 600 IU | Optional target check |
| Adult RDA over 70 | 20 mcg | 800 IU | Optional target check |
| High source marker | 20% DV | 4 mcg | Per serving comparison |
For example: Salmon has heart-healthy fats, and is one of very few food sources of vitamin D (without supplementation). But not all fish are made equal.
Different species have differing levels, depending on how they was caught, farming vs. Wild Atlantic salmon, for example, will result in different levels of nutrient in a fillet compared to, say, a wild sockeye catch. And then cooking change those numbers even further. If you’re checking nutrition labels or tracking your intake for any reason, health-related or otherwise, you’d do well to know the factors at play. Blindly eating fish? It is not as good as it should of been.
Why Fish Nutrition Changes
Salmon has varying amounts of vitamin D depending on the species. After selecting the species and the preparation method, the calculator take care of the math. Next, you’ll pick which species you’re eating. Sockeye typically have more Vitamin D than either pink or coho species, as their different fat contents and diets affects the levels.
Then choose cooked vs. Uncooked weight, since cooking causes a concentration of nutrients per ounce due to water loss. So if you weigh your fish raw, but use cooked values when calculating the nutritional information, you’ll overestimate. The calculator handles that change, provided you select the right starting point. That’s why other factors; such as cooking yield. Cause mistakes.
When you roast or broil salmon, moisture evaporates and its protein contract. A six-ounce raw fillet may end up weighing only four ounces on your plate. Since vitamin D is fat-soluble, it doesn’t boil off along with some water-soluble B vitamins; instead, it remain in the tissue. But the cooked part has more micronutrients per gram compared to the raw material. The calculator takes this into account with yield profiles for both gentle steamed food and firmer roasted items. Gentle treatments keep more of their original weight, whereas dry heat drastically decrease them. Adjust based off whether you trim the bone or leave some skin behind to match how you eat.
Unit conversions are another source of label confusion. Supplements may be listed in International Units (IU) while other references will list them in micrograms (µg). There are 40 IU in one µg. Daily Value as established by the FDA is set to 800 IU or 20 µg. This way, you can read the package and understand the ratio instantly without having to look up a conversion table. A salmon serving that delivers 14 µg will get you about 70% of your DV. You’ll find the comparison numbers on the page so you can compare various preparations side-by-side.
Because of their controlled diet of oil-rich food and algae, farmed salmon tend to be similar across species; they contain consistant amounts of vitamins like vitamin D. By contrast, wild salmon are subject to varying nutrient profiles based on how they feed seasonally and where they travel during migrations. For example, a wild sockeye captured earlier or later in its run may vary.
So while the calculator’s estimates provide a baseline according to standardized USDA reference values, these figures serves as a guide when meal planning… But they shouldn’t be taken as a lab result. They represent a reasonable range, not an absolute number.
Should you choose canned or smoked fish? Both have their own details. Canned sockeye with bone-in has plenty of vitamin D. This provide calcium as well as extra nutrient-rich meat. Smoked chinook will often be packed in two-ounce servings, e.g., on a bagel, and because it’s concentrated, that means more nutrients. That can make switching between fresh and ready-to-eat fish easy. Just double-check that you’re using the appropriate weight basis, otherwise, the arithmetic won’t match up to real life.
Consistency. If you regularly eat salmon (once per week?, Once per day?) knowing the approximate amount of vitamin D you are getting help keep things in perspective as part of your total diet. Since the ability to get sunlight exposure depends on where you live (latitude) and the time of year, food sources becomes even more important during the darker months.
Going from vague notions of “eating well” to specific amounts… Based off how much salmon you actualy cook and how large a serving size is; puts you above guesswork and allows you to see more clearly what’s on your plate. This level of clarity helps make it easier to make consistent habit changes that will contribute to your long-term wellness instead of having to track everything rigidly or guess at what’s going on.