☕ Coffee Roasting Calculator
Estimate green weight, roasted yield, roast loss, development time, and batch loading for repeatable coffee roasting notes.
Choose whether you know your green batch size or your desired roasted output. The calculator adjusts for bean moisture, roast level, and your own loss correction.
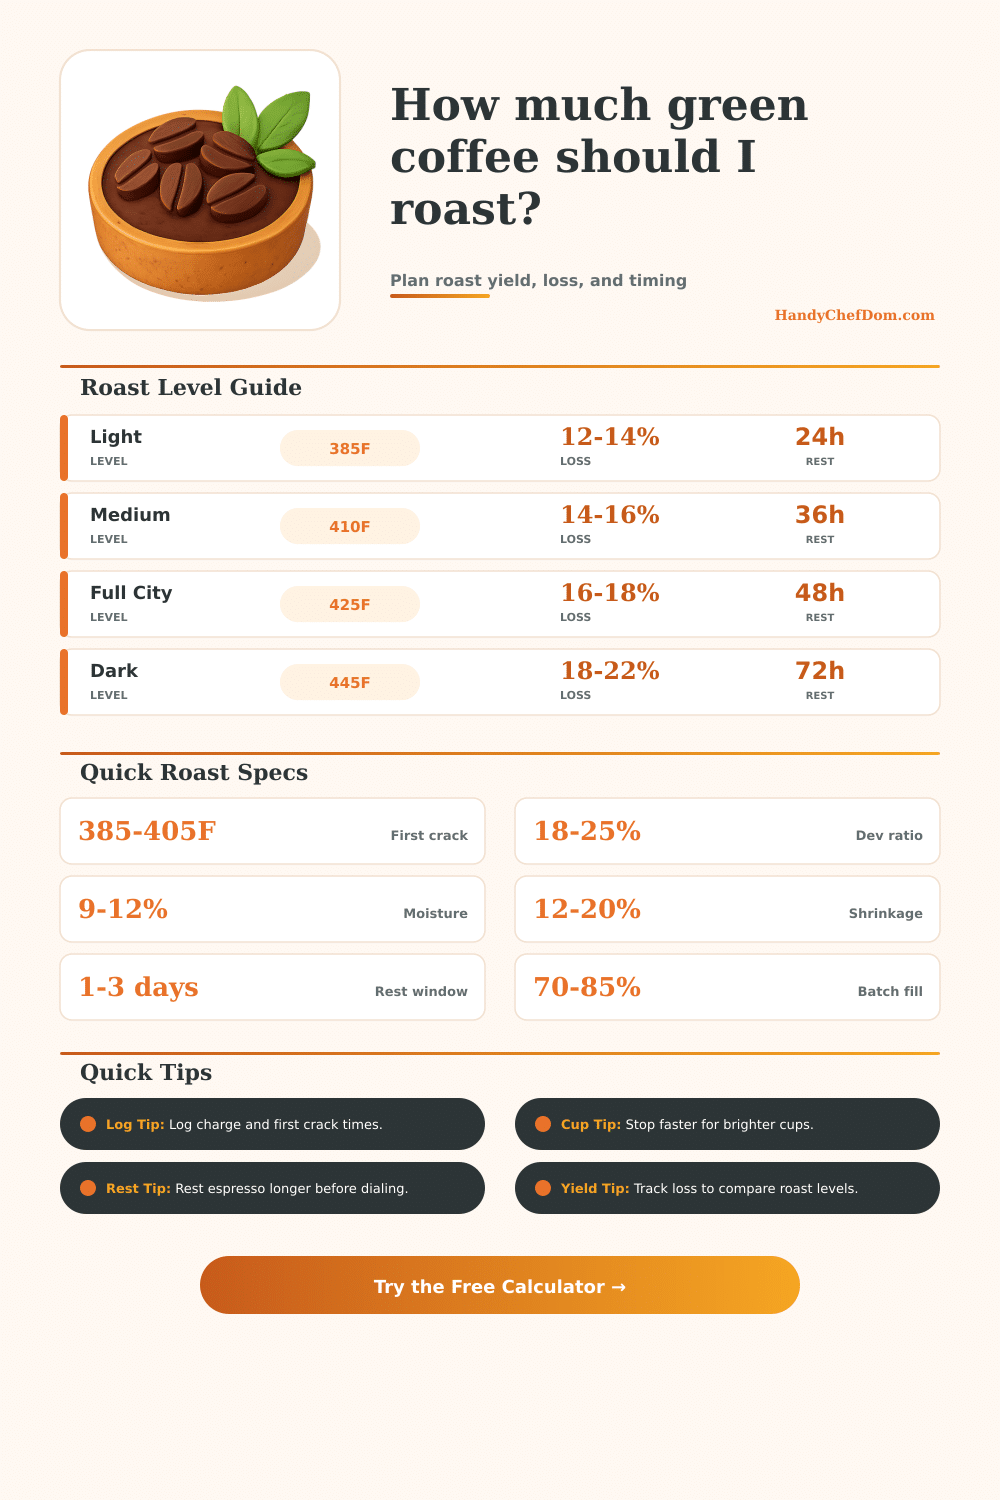
| Roast level | Common drop | Weight loss | Dev ratio | Rest target |
|---|---|---|---|---|
| Sample / cinnamon | 380-390F / 193-199C | 10-12% | 10-14% | 12-24 hr |
| Light / City | 392-405F / 200-207C | 12-14% | 14-18% | 24 hr |
| Medium / City+ | 405-418F / 207-214C | 14-16% | 18-22% | 24-48 hr |
| Full City | 420-430F / 216-221C | 16-18% | 22-26% | 36-72 hr |
| Vienna | 432-442F / 222-228C | 18-20% | 26-30% | 48-96 hr |
| Dark / French | 442-455F / 228-235C | 20-23% | 30-35% | 72-120 hr |
| Green profile | Moisture | Density | Loss cue | Roast note |
|---|---|---|---|---|
| Washed Arabica | 10.0-11.0% | 680-730 g/L | Baseline | Clear progress through drying and browning |
| Natural Arabica | 9.5-10.8% | 650-705 g/L | +0.3% | Can show more chaff and slower color shift |
| Honey process | 9.8-10.8% | 660-715 g/L | +0.1% | Often sits between washed and natural curves |
| High-grown dense | 10.2-11.2% | 720-760 g/L | +0.4% | Usually tolerates more heat early |
| Brazil pulped natural | 9.8-10.5% | 630-690 g/L | -0.2% | Often benefits from a steadier middle phase |
| Sumatra wet-hulled | 10.5-12.0% | 610-670 g/L | +0.7% | Moisture and color can look uneven |
| Swiss Water decaf | 8.0-10.0% | 560-630 g/L | +1.0% | Colors early and needs gentler energy |
| Washed Robusta | 9.8-11.0% | 700-760 g/L | -0.4% | Higher density and lower sweetness perception |
| Roaster type | Sweet spot | Max fill | Typical use | Loading note |
|---|---|---|---|---|
| Sample tray | 60-80% | 85% | 50-150 g | Best for quick comparison batches |
| Fluid bed air | 65-80% | 85% | 70-250 g | Needs enough loft for bean movement |
| Home drum | 70-85% | 90% | 250-700 g | Most repeatable near the middle of capacity |
| Prosumer drum | 70-85% | 90% | 700 g-2 kg | Keep batch size consistent across profiles |
| Commercial drum | 75-90% | 95% | 3-15 kg | Large batches hold momentum longer |
| Roast intent | Dry end | First crack | Dev time | Loss target |
|---|---|---|---|---|
| Sample evaluation | 4:00-5:00 | 7:30-8:30 | 0:55-1:20 | 10-12% |
| Bright filter | 4:30-5:30 | 8:00-9:15 | 1:15-1:45 | 12-14% |
| Balanced filter | 4:45-5:45 | 8:30-9:45 | 1:45-2:20 | 14-16% |
| Modern espresso | 5:00-6:15 | 8:45-10:15 | 2:00-2:45 | 15-18% |
| Traditional espresso | 5:30-6:45 | 9:00-10:45 | 2:30-3:30 | 17-20% |
| Dark blend | 5:30-7:00 | 9:15-11:00 | 3:00-4:15 | 19-23% |
Roast loss is the percentage of weight that a green bean will lose during the roast. Coffee bean lose some of there moisture during the roast, as well as some of the organic matter within the coffee bean. Because no two coffee beans has the same amount of moisture or density, two batches of coffee beans will not weigh the same after roasting, even if they are roasted to the same roast level.
A calculator can help to determine the roast loss that will result from a given green weight, bean profile, and roast level. One of the factor that can impact roast loss is the moisture content of the coffee beans when they are green. Coffee beans that contain more moisture will experience a more greater loss of weight than coffee beans that contain less moisture.
Roast Loss and How It Affects Coffee
Consequently, coffee beans that have a lower density after roasting will impact the way that coffee behave when ground and when brewed. For instance, coffee blends that are to be used in a filter brew may have a low roast loss to preserve the bean structure; espresso blends with high solubility may have a more higher roast loss to even out the sharp acid in the coffee. The development time for coffee beans is the length of time that occurs between the first crack of the coffee bean and the second crack.
Development time has an impact upon the browning of the coffee bean; too short of a development time can result in a coffee bean that taste grassy, while too long of a development time can result in the loss of the bright flavor of the coffee bean. Home roasters may use between 18 and 25% of the total roast time to develop the coffee beans. Development time will vary according to the type of coffee bean being roasted.
For instance, natural processed bean require shorter development times than washed, high-grown beans. The batch size and the roaster capacity will have an impact upon the amount of evenness of heat that is delivered to the coffee beans during roasting. A calculator can help to determine the percentage of the roaster’s capacity that is being utilized.
Too small of a batch size can result in the coffee beans reaching first crack too quick. Too large of a batch size can result in the coffee beans retain their momentum past first crack, leading to an increased development time. Rest time is the length of time that roasted coffee beans sit after they have come out of the roasting drum.
Rest time impact the flavor of the roasted coffee beans when they are brewed. Calculators can be used to determine the suggested length of rest time for coffee beans of a given roast level. The reason that a calculator can determine a given rest time is that darker roasts lose more of their structure during roasting than lighter roasts, and that they lose more carbon dioxide.
Espresso made from dark roasts may taste thin if brewed the day after roasting, but may taste better after seventy-two hours of resting. Filter roasts made with lighter roast levels may taste best within the first forty-eight hours after roasting. In either instance, rest time should of be adjusted to the type of roast and brew method.
Reference tables provide information about roast loss, drop temperatures, and the need for rest of coffee beans of different roast level. Within these tables, people can note the general pattern of how coffee roasting variable change with roast level. For instance, the pattern within most reference tables is that as roast levels darken, the loss of weight of the coffee beans increases, development time increase, and the rest period for roasted beans increases.
These patterns can be used to adjust roast logs for each batch of coffee beans to ensure that roasters dont have to guess at why one roast of coffee may taste different than another roast. Create a log for each batch of coffee beans that you roast. Within the logs, record variables like charge weight, first-crack time, drop temperature, and roasted weight.
Coffee roasters that fail to record these variables will find themselves attempting each batch of coffee beans as an experiment. Those that take the time to create these logs will discover the means of making change to the roasting process that will lead to better tasting coffee. By planning ahead and recording variables like roast loss and development times, coffee roasters will begin to understand why their coffee beans reacted in a certain way within their roasting process.
By utilizing that data, coffee roasters will find that they can make adjustments to their roast recipes according to the data collect during there previous batches of roasted coffee.