🍔 Ground Beef Protein Calculator
Estimate total protein, calories, fat, cooked yield, and per-serving macros from raw or cooked ground beef weight.
Enter the ground beef weight, choose whether it is raw or cooked, then split the protein and macro totals across patties, tacos, bowls, or meal prep servings.
| Ground Beef | Protein / 100 g Raw | Fat / 100 g Raw | Calories / 100 g Raw |
|---|---|---|---|
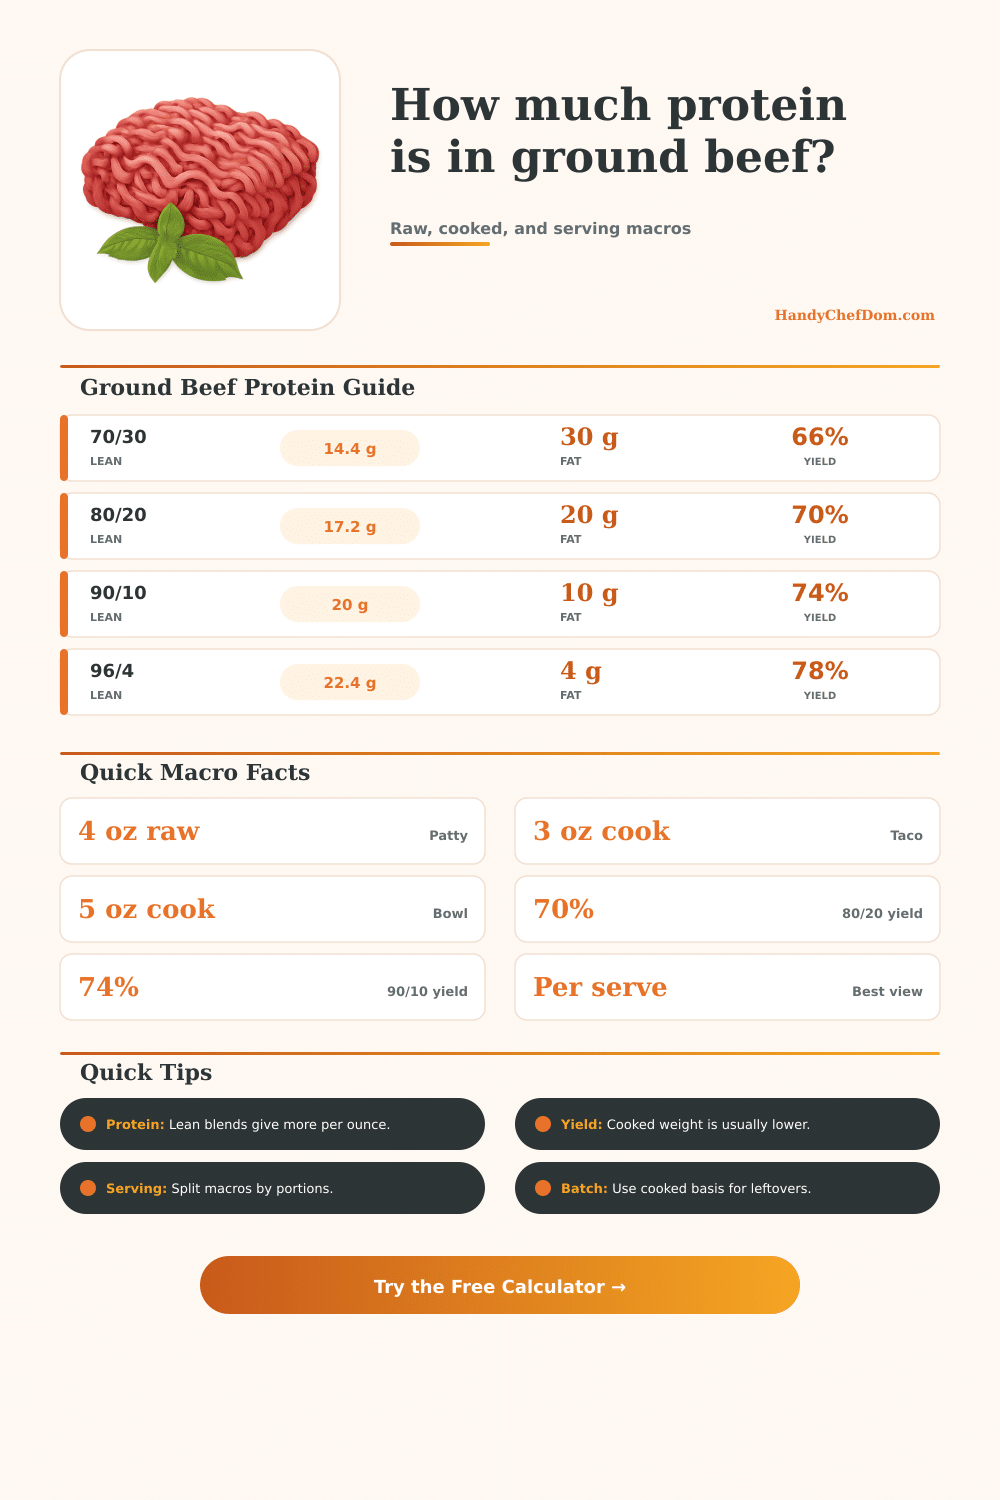
| 70/30 ground beef | 14.4 g | 30.0 g | 327 |
| 73/27 ground beef | 17.0 g | 27.0 g | 315 |
| 80/20 ground beef | 17.2 g | 20.0 g | 254 |
| 85/15 ground beef | 18.6 g | 15.0 g | 215 |
| 88/12 ground beef | 19.1 g | 12.0 g | 190 |
| 90/10 ground beef | 20.0 g | 10.0 g | 176 |
| 93/7 ground beef | 21.4 g | 7.0 g | 150 |
| 96/4 ground beef | 22.4 g | 4.0 g | 121 |
| Lean Blend | Typical Cooked Yield | Raw 1 lb Becomes | Best Use |
|---|---|---|---|
| 70/30 | 66% | 10.6 oz cooked | Juicy patties |
| 73/27 | 67% | 10.7 oz cooked | Classic burgers |
| 80/20 | 70% | 11.2 oz cooked | Burgers and tacos |
| 85/15 | 72% | 11.5 oz cooked | Bowls and skillet beef |
| 88/12 | 73% | 11.7 oz cooked | Meal prep |
| 90/10 | 74% | 11.8 oz cooked | Lean taco filling |
| 93/7 | 76% | 12.2 oz cooked | High protein bowls |
| 96/4 | 78% | 12.5 oz cooked | Very lean portions |
| Serving Style | Raw Planning Size | Cooked Portion | Protein Focus |
|---|---|---|---|
| Burger patty | 4 oz raw | 2.7-3.1 oz cooked | One patty per serving |
| Smash patty | 2 oz raw | 1.3-1.6 oz cooked | Two patties per serving |
| Taco filling | 3-4 oz raw | 2.1-3 oz cooked | Split across shells |
| Rice bowl | 5-6 oz raw | 3.6-4.5 oz cooked | Higher protein meal |
| Meal prep box | 5 oz raw | 3.5-3.9 oz cooked | Repeatable portions |
| Chili serving | 3 oz raw | 2.1-2.3 oz cooked | Blended batch macro |
| Batch Scenario | Beef Weight | Servings | Good Starting Blend |
|---|---|---|---|
| Weeknight tacos | 1.25 lb raw | 6 | 85/15 or 90/10 |
| Burger dinner | 1 lb raw | 4 | 80/20 |
| Meal prep bowls | 2 lb raw | 5 | 90/10 or 93/7 |
| Party sliders | 3 lb raw | 12 | 80/20 or 85/15 |
| Chili batch | 2.5 lb raw | 8 | 85/15 |
| Taco bar | 4 lb raw | 12 | 88/12 or 90/10 |
The raw meat shrivels as it cooks, which might make you think: do I have a big enough tub of ground beef to feed me and three others? Depending on the fat content, a pound of lean beef differ from a pound of fatty burger meat. Plugging in your weight plus your blend choice into calculator does the math for you. You won’t have to guess whether you’ll run out of food by lunchtime.
Also, ground beef isn’t one thing; it’s a ratio of muscle to marbling. And typically that’s given in percentages, with two numbers such as 93/7 or 80/20. The first number is lean meat; the second is straight up fat. Why does it matter? Because during cooking, the fat cooks out. So when you purchase an eighty percent lean bag, you’re essentially buying a pound of fat that’s mostly going to melt away in your pan. Blends containing less fat (such as ninety-three percent and ninety-six percent) doesn’t fall apart quite as easily, but also don’t have that same rich texture than juicer combinations.
How to Know What You Get After Cooking Ground Beef
The table on the page clearly shows exactly what you get per pound of raw meat and what you have left after cooking. The percentage of protein in a given cut isn’t fixed based off its grade; it’s actualy lower in fattier cuts of beef. As the amount of fat compared to meat go down, there is more protein left. The difference is substantial: a hundred grams of ninety-six percent lean beef contains significantly more protein than same weight of seventy percent lean meat. If you’re trying to increase your protein intake while staying under a certain calorie limit, selecting an appropriate combination are as critical as controlling portions. You can see both yields and totals so that you can visualize how those two factors balance each other out.
The other factor here is cooking method; does all the fat end up on your plate? Fat drains away when you cook, which result in less weight at the end. This also means there are fewer calories and fewer gram of saturated fat. Chefs like an 80/20 blend for burgers because they stays moist with a little bit of fat left. The calculator lets you tweak the “yield percentage” (how aggressively do you drain off the fat?) as well, since leaving some fat behind will result in more cooked weight.
When you make chili, or if you’re making tacos and skim most of the fat off when it renders out during cooking, then the amount of cooked weight will be less than assumed default. Dial that number down accordingly to reflect what realy happens in the real world.
While it’s intuitive to plan for meals based on raw weight, things get wonky when you’re breaking up serving sizes. For instance, you may think that a single burger patty weigh four ounces raw, but after cooking it’s closer to three. Portioning out a big batch into meal prep containers makes a huge difference in how accurately you can track your calories. This is because of the difference between cooking weight and raw weight. You can enter these totals into the servings input field. This breaks them down into something more reasonable. It is one less way that you’ll accidently eat too little or too much because your mental math was off.
Cooking time and temp matter for fat retention. Cooks faster? Fat will render quicker. Slow-cooked? Leave some residual fat.
Time to prioritize: What matters more today… Food enjoyment, or hitting exact macros? The protein plan has a buffer feature. This means there’s a little extra wiggle room built into the numbers to account for normal fluctuations with water and packaging in meats. This was designed as a safety net for perfectionists (who also don’t want to get too hung up on weighing things each time they meal prep). There’s no magic bullet here… You have to choose what matters most, convenience versus accuracy.
For some, they really want to know precisely about calories (perhaps they’re tracking their diet) while others just want a rough estimate. If you’ve been making certain dishes before (e.g., tacos, burgers), then the pre-set buttons can speed up the process. It load reasonable defaults so that you get results right away. Tweaking it also demonstrates how much your results will change based off a few grams more or less of fat or weight.
But all in all, getting to know the ingredients you’re working with means fewer wasted ingredients, better food, and less guesswork. No longer do you have to wonder if that half-pound of meat is going to feed a family or just yourself. It turns a sloppy process into something tangible, translating raw guesses into real numbers: How much protein went onto my plate? Turns out I know, and that makes making dinner feel less like a chore and more like solving a puzzle.