🐟 Salmon Protein Calculator
Estimate protein, calories, fat, and omega-3 from salmon cuts, raw or cooked weight, skin-on yield, and serving count.
Enter either raw salmon weight or cooked edible weight. The calculator adjusts for cut yield, skin handling, servings, and a planning buffer.
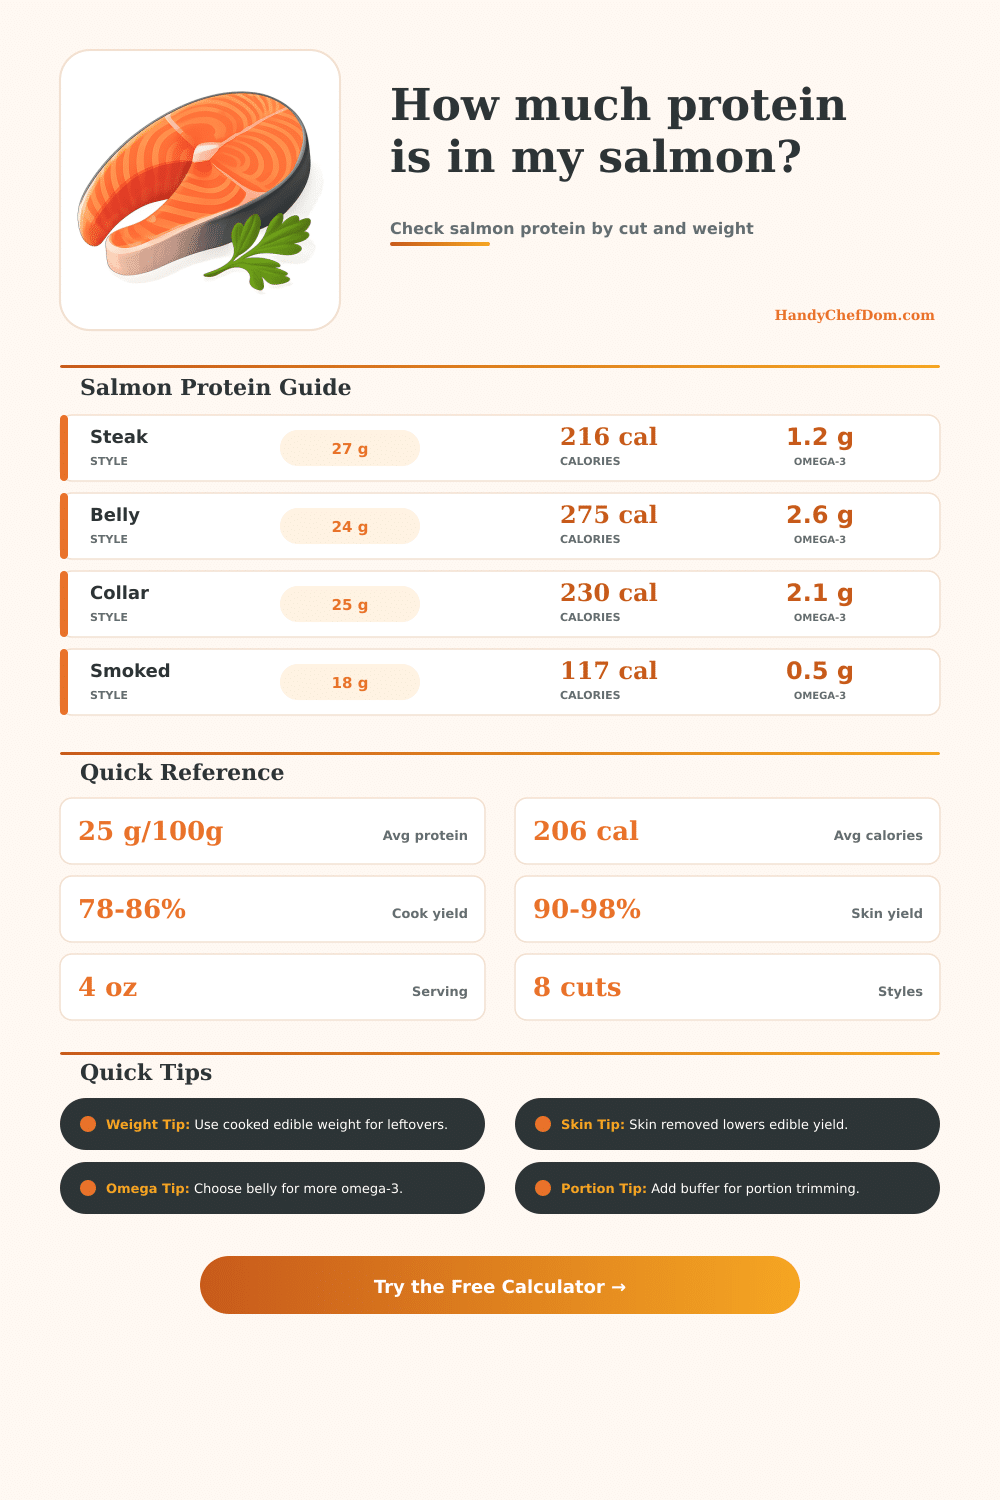
| Salmon Cut or Style | Protein / 100 g | Calories / 100 g | Fat / 100 g | Omega-3 / 100 g |
|---|---|---|---|---|
| Atlantic salmon portion | 25.4 g | 206 cal | 12.4 g | 2.2 g |
| Sockeye salmon steak | 27.3 g | 216 cal | 11.0 g | 1.2 g |
| Coho salmon steak | 25.0 g | 178 cal | 8.2 g | 1.1 g |
| King salmon belly | 24.0 g | 275 cal | 20.0 g | 2.6 g |
| Salmon collar | 25.0 g | 230 cal | 15.0 g | 2.1 g |
| Whole salmon side | 25.2 g | 208 cal | 12.8 g | 2.0 g |
| Skin-on salmon roast | 25.1 g | 214 cal | 13.4 g | 2.1 g |
| Canned salmon, drained | 24.6 g | 138 cal | 4.4 g | 0.9 g |
| Smoked salmon slices | 18.3 g | 117 cal | 4.3 g | 0.5 g |
| Cut or Style | Default Cook Yield | Skin Removed Yield | Best Weighing Basis |
|---|---|---|---|
| Atlantic portion | 82% | 90% | Raw or cooked |
| Sockeye steak | 80% | 91% | Raw weight |
| Coho steak | 83% | 91% | Raw weight |
| King belly | 84% | 96% | Cooked edible |
| Salmon collar | 78% | 88% | Cooked edible |
| Whole side | 81% | 90% | Raw weight |
| Skin-on roast | 82% | 90% | Raw weight |
| Canned drained | 100% | 100% | Cooked edible |
| Smoked slices | 100% | 100% | Cooked edible |
| Serving Plan | Cooked Edible Weight | Protein Range | Use Case |
|---|---|---|---|
| Light plate | 3 oz / 85 g | 16-23 g | Brunch or sides |
| Standard plate | 4 oz / 113 g | 21-31 g | Dinner serving |
| High protein | 5 oz / 142 g | 26-39 g | Training meals |
| Meal prep box | 6 oz / 170 g | 31-46 g | Lunch portions |
| Small tasting | 2 oz / 57 g | 10-16 g | Shared platter |
| Large plate | 8 oz / 227 g | 42-62 g | Big appetite |
| Scenario | Servings | Common Style | Raw Salmon To Start |
|---|---|---|---|
| Weeknight dinner | 4 | Steaks | 20-24 oz |
| Family tray | 6 | Whole side | 32-38 oz |
| Meal prep | 8 | Portions | 48-56 oz |
| Brunch board | 10 | Smoked slices | 20-30 oz |
| Small plates | 12 | Belly | 36-48 oz |
| Gathering | 16 | Roast | 90-110 oz |
Not all salmon is created equal. The protein percentage stay pretty much the same regardless of whether it’s fatty or lean. Some are fatty and some is lean.
How much meat stays on the fish after cooking depend off the cut. Even if they look similar, one might shrink more then another once cooked. Most fish loses between twelve and twenty-two percent of its weight when it firms up. It’s not like buying chicken. Wild vs. Farmed also makes a difference with salmon as does type of fish.
Why Salmon Weight Changes When Cooking
What is your goal? Lean or fatty? When you enter the weight basis and the cut type, the calculator will adjusts for these factors. The calculator adjusts based on whether you weigh your fish cooked or raw.
Water leaves the meat while it firms up resulting in a higher raw weight. This typically causes most fish to lose between 12 and 22% of their original weight. To accommodate this loss, the tool uses yield coefficients. Steaks also present a greater amount of surface area exposed to heat, which impacts final edible weight, despite having similar protein percentage.
If your goal is to hit a certain protein number while not going over a particular amount of fat, then it’s important to know what you’re eating. Higher-fat cuts like belly has more calories by weight. This may be a factor for those who want to eat as much protein as possible in their meals (they’re delicious and easy to cook), but it’ll skew your macros.
Cured fish are also lower protein then dense Atlantic pieces because the cure process dehydrates them somewhat. The cut also impacts your omega-3 numbers. Belly cuts contains more of these fatty acids. For people who don’t consume other types of marine oils, this can be a useful way to get some in.
Another thing to remember: skin matters. Because there isn’t a lot of protein in the skin and it’s full of fat and calories, this impacts accuracy. If you’re going to consume the skin, enter it into the amount you’ll consume. This way the calculator can take that out of total nutrient estimate.
If you’re going to remove it before eating, this decreases the yield percentage of cooked meat as well (you’re throwing away some of the stuff). The calculator asks about it because it needs to subtracts that weight out. Otherwise, you’ll have more protein than you actualy end up consuming. It may seem like a small factor but precision matters.
Now, let’s tie theory and practice together with servings. Generally speaking, an average dinner portion of fish is four ounces when cooked and ready to eat. That will give you approximately twenty-five to thirty grams of protein per serving depending upon your cut. If you are planning ahead like making several meals in one sitting for the workweek, you may want to plan accordingly so that every meal reaches or exceeds that number. The option to tack on a bit extra as a buffer for uneven pieces/trimming helps here. You can never really have too much protein but you certainly would of don’t want to fall a few grams short.
Many home cooks greatly under-estimate shrinkage of their catch while baking or roasting. This makes sense. Food change when cooked. To track accurately, we must account for these changes. Raw weight is potential; cooked weight is reality. The tools turns this change into something useful.
Sure, you’re selecting a richer belly cut or leaner sockeye steak but that decision remains your own. That’s your preference. Your call. The math won’t judge you, only ensure you are buying what ends up in your mouth. Intentional weighing takes the guesswork out of using a scale in the kitchen. You no longer have to wonder. You now know precisely what’s on your plate.