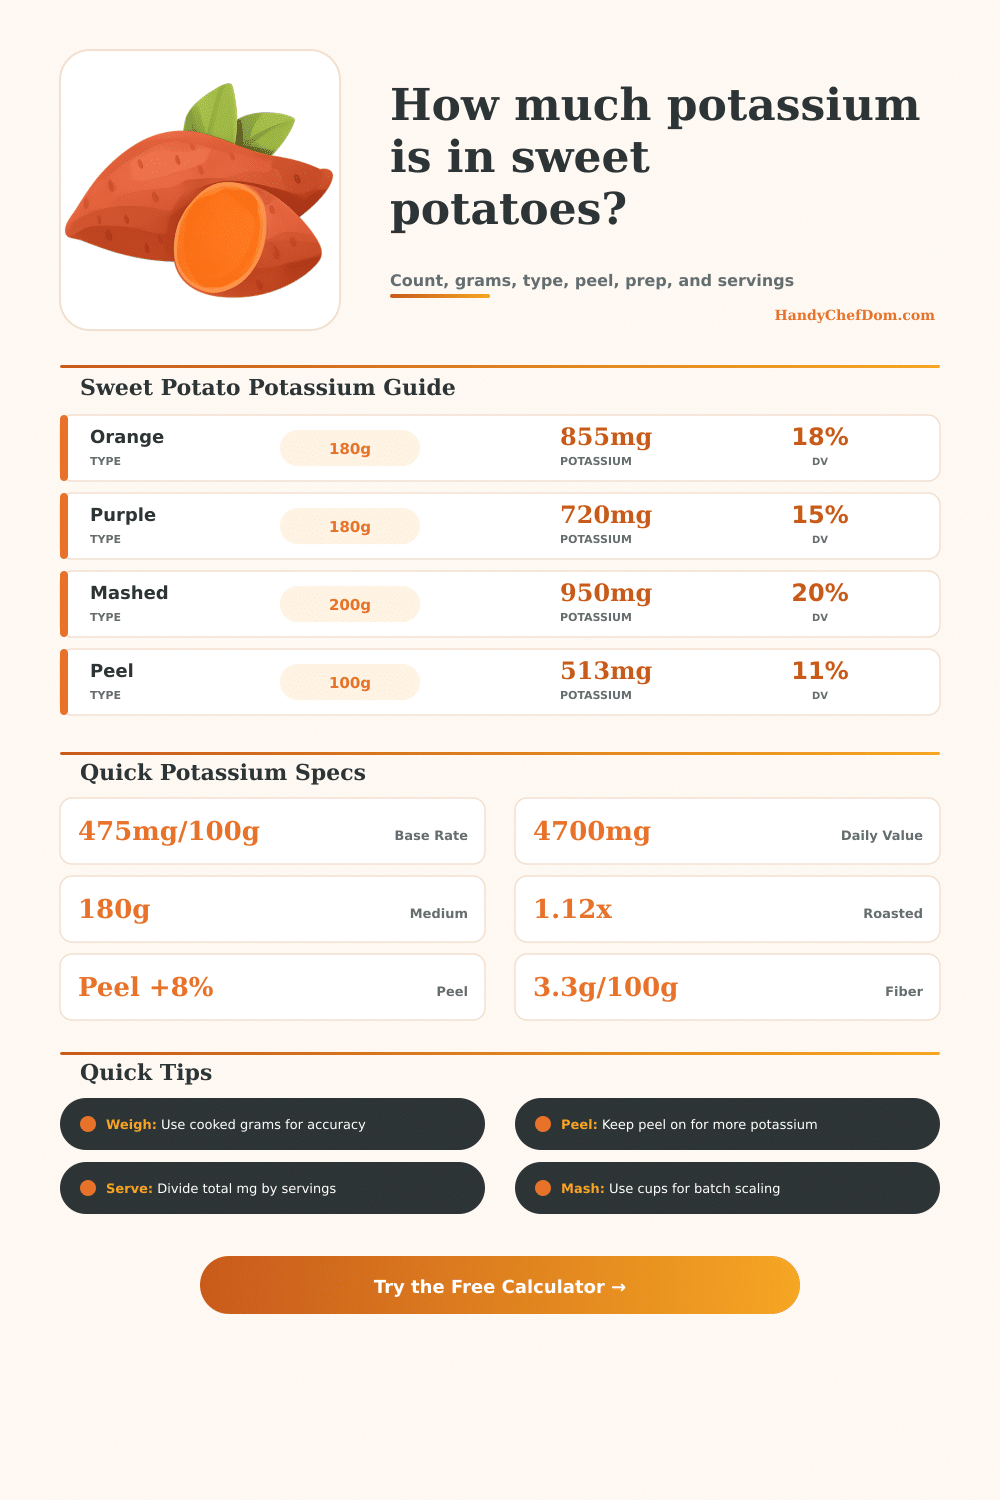
🍠 Sweet Potato Potassium Calculator
Estimate potassium milligrams, per-serving daily value, fiber and sugar context, and batch scaling from sweet potato weight, count, type, peel, prep method, and serving count.
🍠Sweet Potato Potassium Presets
🧮Sweet Potato Potassium Inputs
Use count and size for a quick kitchen estimate, cooked grams for the cleanest potassium math, or mashed volume for casserole and meal-prep batches. Fiber and sugar are shown only as context so the main result stays potassium-focused.
📊Potassium Snapshot Grid
🔍Sweet Potato Potassium Context Cards
📘Sweet Potato Type, Prep, And Potassium Grid
| Sweet potato type and prep | Typical serving | Potassium estimate | Default DV percent | Fiber and sugar context |
|---|---|---|---|---|
| Orange baked, peel on | 180 g medium | 924 mg | 20% | 6.7 g fiber, 11.9 g sugar |
| Orange baked, peeled | 180 g medium | 855 mg | 18% | 5.9 g fiber, 11.7 g sugar |
| Purple baked, peel on | 180 g medium | 778 mg | 17% | 6.1 g fiber, 10.3 g sugar |
| Japanese roasted, peel on | 180 g medium | 955 mg | 20% | 6.5 g fiber, 13.6 g sugar |
| Hannah mashed, peeled | 200 g cup | 820 mg | 17% | 5.6 g fiber, 12.0 g sugar |
| Mixed roasted tray | 250 g serving | 1330 mg | 28% | 9.0 g fiber, 16.9 g sugar |
📏Count And Weight Conversion Table
| Size shortcut | Cooked edible weight | Orange peeled potassium | Orange peel-on potassium | Best calculator use |
|---|---|---|---|---|
| Small sweet potato | 130 g | 618 mg | 667 mg | Small side or kid portion |
| Medium sweet potato | 180 g | 855 mg | 924 mg | One main side serving |
| Large sweet potato | 250 g | 1188 mg | 1283 mg | Large bowl or meal prep |
| Extra large sweet potato | 340 g | 1615 mg | 1744 mg | Split for two servings |
| Mashed sweet potato | 1 cup, 200 g | 950 mg | 1026 mg | Mashed batch scaling |
| Roasted cubes | 1 cup, 160 g | 851 mg | 919 mg | Tray and bowl portions |
🍳Preparation And Peel Factor Table
| Preparation choice | Potassium factor | Cooked yield factor | Fiber factor | Calculator note |
|---|---|---|---|---|
| Baked whole | 1.00x | 0.78 from raw | 1.00x | Balanced all-purpose setting |
| Roasted cubes or wedges | 1.12x | 0.70 from raw | 1.02x | Moisture loss concentrates final weight |
| Mashed cooked sweet potato | 1.00x | 0.78 from raw | 0.96x | Use packed cups or cooked grams |
| Steamed pieces | 0.96x | 0.84 from raw | 0.98x | Slightly lighter potassium density |
| Boiled and drained | 0.88x | 0.86 from raw | 0.94x | Water contact can lower retained potassium |
| Peel on or mostly eaten | 1.08x | No weight change | 1.14x | Adds potassium and fiber context |
🥣Serving And Batch Scaling Table
| Batch target | Target cooked amount | Orange potassium | Typical servings | Scaling rule |
|---|---|---|---|---|
| Side dish serving | 150 g | 713 mg | 1 side | Cooked grams divided by 150 |
| Meal prep bowl | 220 g | 1045 mg | 1 bowl | Cooked grams divided by 220 |
| Mashed cup portion | 200 g | 950 mg | 1 cup | Mashed cups times 200 g |
| Casserole pan | 1200 g | 5700 mg | 10 portions | Cooked grams divided by 1200 |
| Small kid portion | 90 g | 428 mg | 1 small side | Cooked grams divided by 90 |
| Large athlete portion | 300 g | 1425 mg | 1 large side | Cooked grams divided by 300 |
💡Sweet Potato Potassium Tips
Potassium, It’s one of those nutrients that always feels elusive, and one that turns up in familiar kitchen ingredients. Sweet potatoes, if you’ve got any, should of hanging around somewhere at this point. And these aren’t just sugary starches we’re talking about; they’re also a source of good minerals.
How do you know how much potassium there is in what you prepare? Baked (skin-on) vs. Are they boiled with the skins off? Whether they are peeled or unpeeled matter. All will affect totals. The common assumption is that bigger = better. Yes, a big sweet potato has more potassium then a little one. But what if we cook it? How does cooking affect minerals in finished product?
How Cooking Changes Sweet Potato Potassium
Some minerals leach out during boiling. Others get more concentrated when foods is roasted without any water. The calculator takes these physical changes into account and applies certain factors to baseline values. Again, you don’t have to remember these figures. Just grasp the concept behind them: Potassium goes down the drain when you boil your potatoes; what’s left stays more highly concentrated in the food you eat.
There’s also more to the skin than just fiber. A large part of mineral content is found in the skin. If you leave it on, your potassium estimate go up about eight percent. When you’re working with whole foods and trying to reach your daily goals, that can make a difference. While many people peel their sweet potato before cooking for improved texture they are forfeiting some of their nutritional value as well. If sweet potatoes is a regular food in your diet, this little decision adds up.
Then there’s the type of potato. While orange flesh varieties are standard benchmark, there are other types with different nutrition profiles: white and purple varieties, for example. The calculator accounts for this variation, giving you an accurate number instead of a generalized average. One variety could possibly be drier or thicker than another. (We’re talking about scaling up recipes for a big group or making meals ahead here.) Is it a Japanese sweet potato? That can also change things.
But there are some variables that come into play with batch cooking. For example, it’s hard to know how much weight is in 8 cups of mashed sweet potatoes from a big batch. We use weight for potassium (milligrams), and we use volume for cups. The converter makes this conversion for you without you having to estimate the number of grams per cup of mash. Plus, if you’re feeding a group it will help too. You can see total milligrams in your pan, then divide that up by the servings. That way you’ll know exactly how much each individual is consuming.
Depending on your diet restrictions and/or your health goals, you may want to set a different daily target for yourself. Four thousand seven hundred milligrams is standard reference number, but certain protocols recommend setting a baseline higher or lower than that. If you adjust it to a different number, the percentage read out will shift while total amount of food stays the same… It just shifts how full that meal makes you feel in context off your entire day.
It isn’t about some end figure. With the tool, you see all those adjustment factors (including prep) side-by-side with the weights. Then you can say to yourself “hmm… why did I get such a high potassium count?” Was that because of size of the potatoes I used? Was it because I boiled them or roasted them? Once you know that, you’re able to choose differently going forward.
To be clear: This doesn’t require becoming a nutritionist. It only requires paying attention to the way that you prep your food. If it’s got skin, leave it on. Want the most minerals? Roast rather than boil. Are you precise enough to weigh your portions? Good for you! Do you need a quick estimate in the kitchen? Go by size and count. The math is complicated; the habits are simple.
Food science isn’t so much about counting down every last milligram as it is knowing impact of our choices. That is what makes a small root vegetable a steady source of strength.