🍺 Weekly Drinks Alcohol Calculator
Track beer, wine, spirits, and cocktails by ABV, serving size, drinking days, standard drink equivalent, alcohol grams, and pacing window.
Enter the number of servings for the week, the actual pour size, and the ABV from the label or menu. This is a math-only tracker for U.S. standard drink equivalents; it does not estimate BAC, impairment, or personal risk.
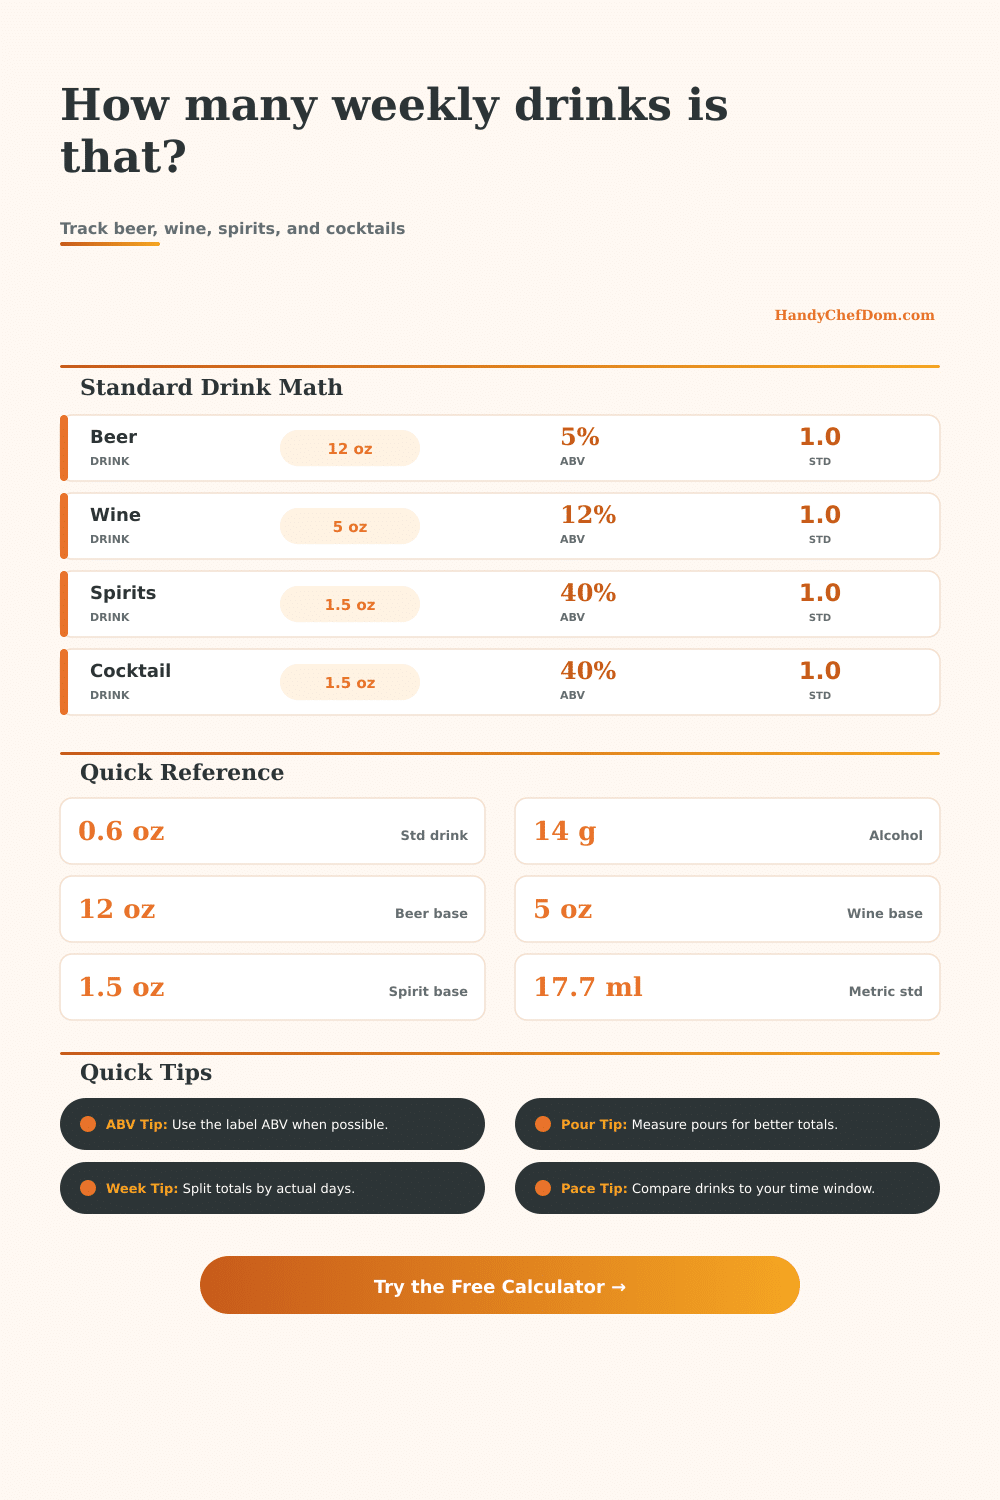
| Drink Type | Reference Serving | Reference ABV | Standard Drinks |
|---|---|---|---|
| Regular beer | 12 fl oz | 5% | 1.0 |
| Stronger beer | 12 fl oz | 7% | 1.4 |
| Table wine | 5 fl oz | 12% | 1.0 |
| Higher ABV wine | 5 fl oz | 14.5% | 1.2 |
| Distilled spirits | 1.5 fl oz | 40% | 1.0 |
| Double pour spirits | 3 fl oz | 40% | 2.0 |
| ABV Band | Common Example | Serving to Enter | Math Note |
|---|---|---|---|
| 3% to 4% | Session beer | Can or glass size | Lower ABV per ounce |
| 4.5% to 6% | Lager or cider | Bottle or pint size | Close to beer base |
| 8% to 10% | Strong ale | Actual pour size | Often above one drink |
| 11% to 15% | Wine | Measured wine pour | ABV changes totals |
| 35% to 50% | Spirits | Shot or jigger size | Small volume counts fast |
| 15% to 30% | Low proof liqueur | Base amount used | Useful for cocktails |
| Preset | Beer | Wine | Spirits | Cocktails |
|---|---|---|---|---|
| Wine With Dinner Week | 0 servings | 7 pours | 0 pours | 0 drinks |
| Game Day Beers | 6 servings | 0 pours | 0 pours | 0 drinks |
| Cocktail Weekend | 0 servings | 0 pours | 0 pours | 6 drinks |
| Mixed Social Week | 4 servings | 3 pours | 2 pours | 2 drinks |
| Low ABV Plan | 4 servings | 2 pours | 0 pours | 2 drinks |
| Tasting Flight Week | 4 tasters | 6 tasters | 4 tasters | 0 drinks |
| Vacation Drinks | 8 servings | 5 pours | 4 pours | 6 drinks |
| Dry Week Comparison | 0 servings | 0 pours | 0 pours | 0 drinks |
| Pacing Input | What It Means | Formula Used | Result Use |
|---|---|---|---|
| Drinking days | Days with any drink | Total divided by days | Average day |
| Busiest share | Percent on one day | Total times share | Peak day estimate |
| Time window | Hours for busiest day | Minutes divided by drinks | Average spacing |
| Planned spacing | Your intended interval | Compared with average | Pacing check |
| Drink equivalent | 0.6 fl oz alcohol | Pure oz divided by 0.6 | Standard drinks |
| Alcohol grams | Pure alcohol weight | Standard drinks times 14 | Metric total |
Standard drink math uses the U.S. reference of 0.6 fl oz, about 14 g, of pure alcohol. Results are arithmetic estimates based on the values entered.
Maybe you think of a standard drink as a neat little unit. It’s not that simple. A standard drink is just an idea.
In the United States, a standard drink have about fourteen grams of pure alcohol in it. That fits into a five percent beer in a twelve ounce can. That fits into a five ounce glass of twelve percent wine. That fits into a shot of forty percent spirits. The alcohol doesn’t change; only the volume do.
How to Use the Calculator
And this makes all the difference, because almost no one keeps track of grams; we keep track of glasses. We don’t count ethanol going in our system; we count the beer we drink. There’s a gap there and that’s where the confusion lives.
To use the calculator above, plug in the exact percentage of alcohol by volume (which most bottles label) and amount of each drink you’re having. This does all of the math for you. No more guessing at coefficients or conversions.
How much does an eight-percent ABV craft IPA differ from a five-percent craft lager? Hint: It’s not just a bit stronger. An eight percent ABV are nearly twice the alcohol content of a light lager. That means if you drink two beers in the time it typically takes to drink one, you’ve basically doubled your alcohol intake. However, you have done nothing differently to change the situation. You didn’t intend to drink more; you still drank the same way you always do and math doesn’t care about your intent. All the math cares about is how much you consumed and its concentration.
The same goes for wine: casual drinkers often gets tripped up there too. At restaurants, the pour is typically more than five ounces, the reference standard. If someone pours until the glass are full, you’re probably getting eight or even ten ounces. And that’s a big jump from a pure-alcohol perspective. The ABV might still be moderate. By typing in the actual amount you’re getting in a pour, the tool lets you see this and, again, forget about the industry’s helpful fiction of the standard serving size.
You can measure your own pours at home which reduces your total per week. Or you can ask for smaller pours when eating out. It’s a small change but it makes a difference.
The largest variable is in cocktails. There is no standard base, so a half-ounce of tequila at one bar is different from a two-ounce pour at another. It is not subtle. That’s the difference between a light evening and a heavy one.
Total breakdown is by beverage type. It will show you exactly how much each category contribute to your overall intake. That can be helpful when it comes to finding patterns. Maybe you see that your Tuesday wine routine isn’t too crazy. But your Friday cocktail habit is where the numbers starts spiking. Once you know where the volume come from, you’re able to make targeted adjustments. Don’t have to stop drinking altogether. Just adjust the mix.
The other half of the equation that everyone ignores is pacing. Total weekly intake will tell you one thing. Another thing is how that intake are distributed. Six standard drinks spread across seven days has a different physiology than those six drinks consumed in an hour on Saturday night.
There are fields for pacing (busiest day) and drinking days in the calculator. That shows you the distribution. It calculates estimated minutes per drink on your heaviest day. That’s a reality check about just how fast you’re taking in alcohol compared to how fast your body can process it.
It’s a math only tracker. It does not estimate personal risk or blood alcohol content. It just lays out arithmetic of what you do. Now that you understand what this means, you’re able to make educated decisions regarding your health and your social life. There’s no need for you to turn into a chemist when managing what you consume. All you need is some correct information.
There are a couple of reference tables on the page that show how the standard drink value change based off the band of alcohol by volume (ABV). A nine percent strong ale is far removed from a three percent session beer. Both could easily fit inside a single glass. This tool removes the menu descriptions and the marketing. What remains is the raw data.
That data isn’t intended to shame you. It’s designed to inform you. Now that you know how many standard units are in every glass, you’ll be able to choose whether or not it fits with your week. Clarity is the aim. Control follows clarity. And control allows you to enjoy your drinks while avoiding the guessing game.